"Show how STEAM can be applied to help your local community."
We are honored to be the 2016-17 South Carolina State Winner of the Samsung Solve for Tomorrow competition! Follow our progress as the CAD/CAM and Next Energy classes collaborate to design, test, and optimize a personalized flood advisory system and inspire others in our community to use STEAM to solve problems!
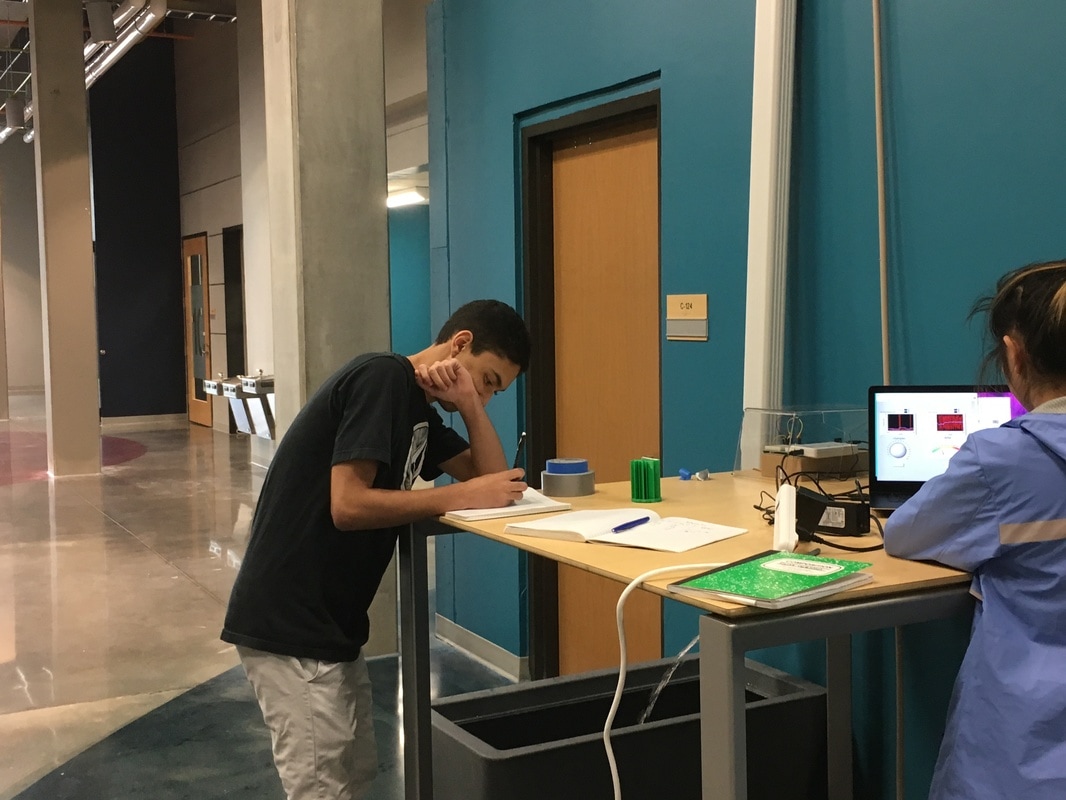
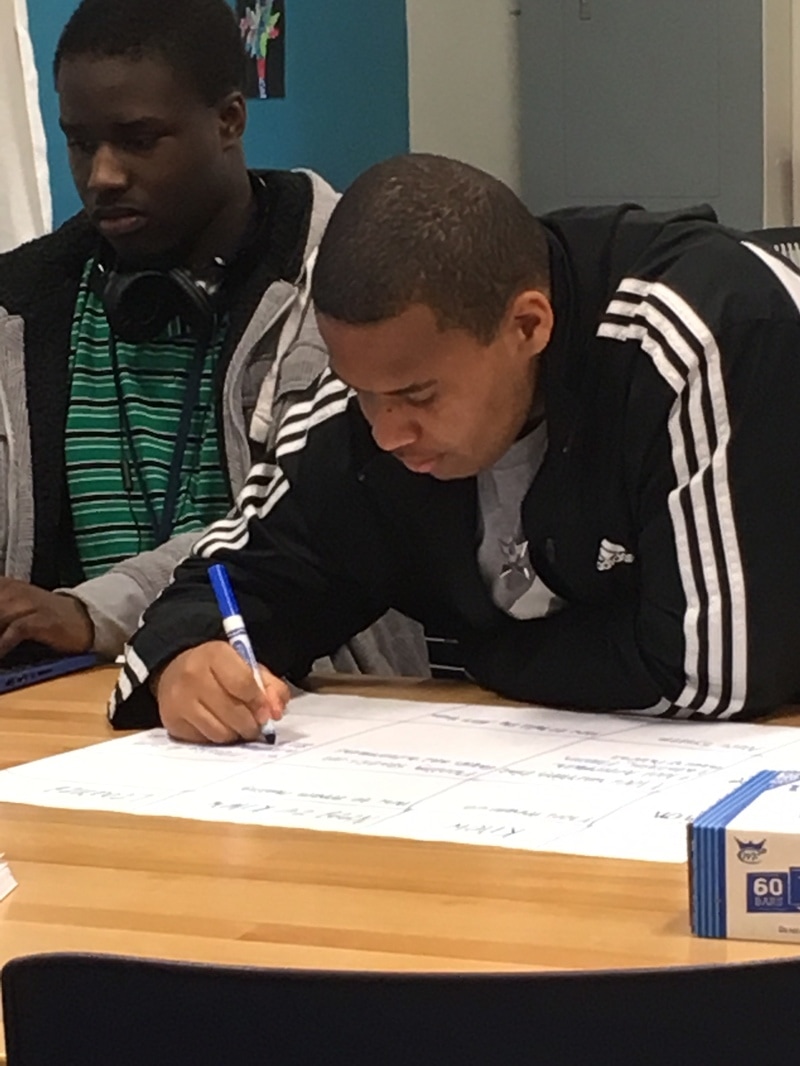
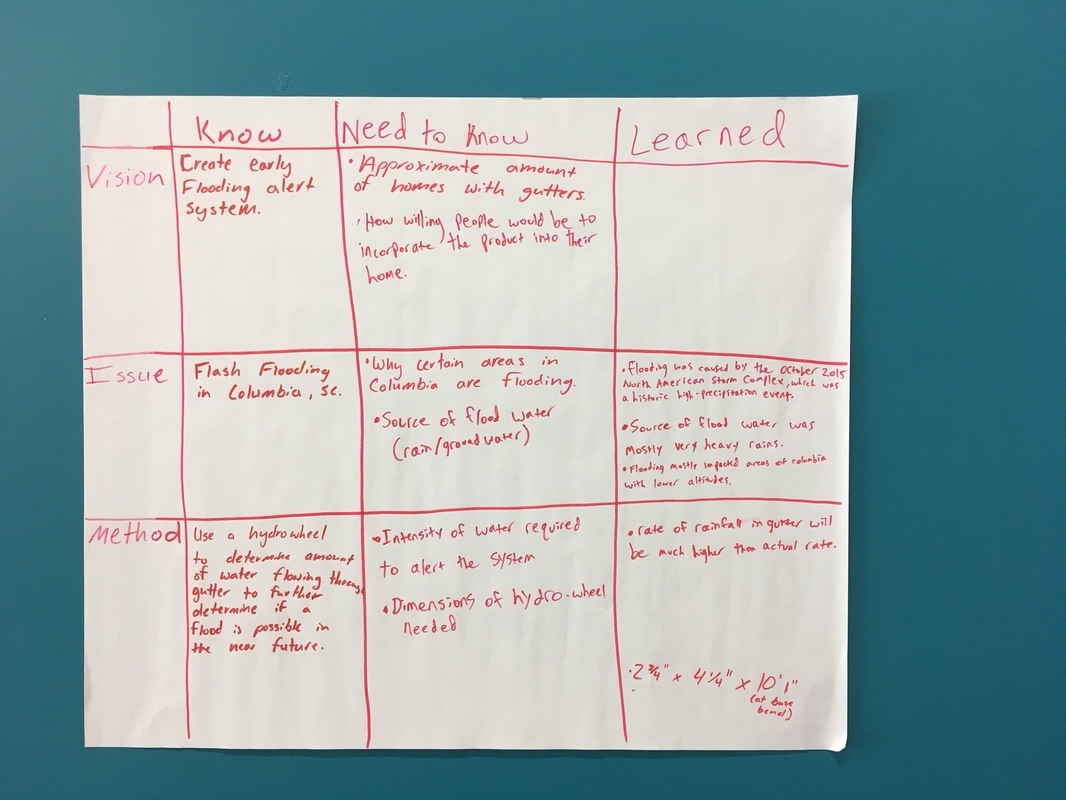
Step 1: Identifying the problem
We began by researching factors that led to the catastrophic flooding in Columbia over the last two years, and determining what rainfall levels are considered flooding vs. heavy rain. One realization we made from our research was that flooding is determined not only by the rainfall, but its duration. We found in our research that the flooding in 2015 was caused by the North American Storm Complex, which resulting in very heavy rains. Each group created a table of prior knowledge of flooding and hydropower, what we still needed to learn, and what we found out from our online research.

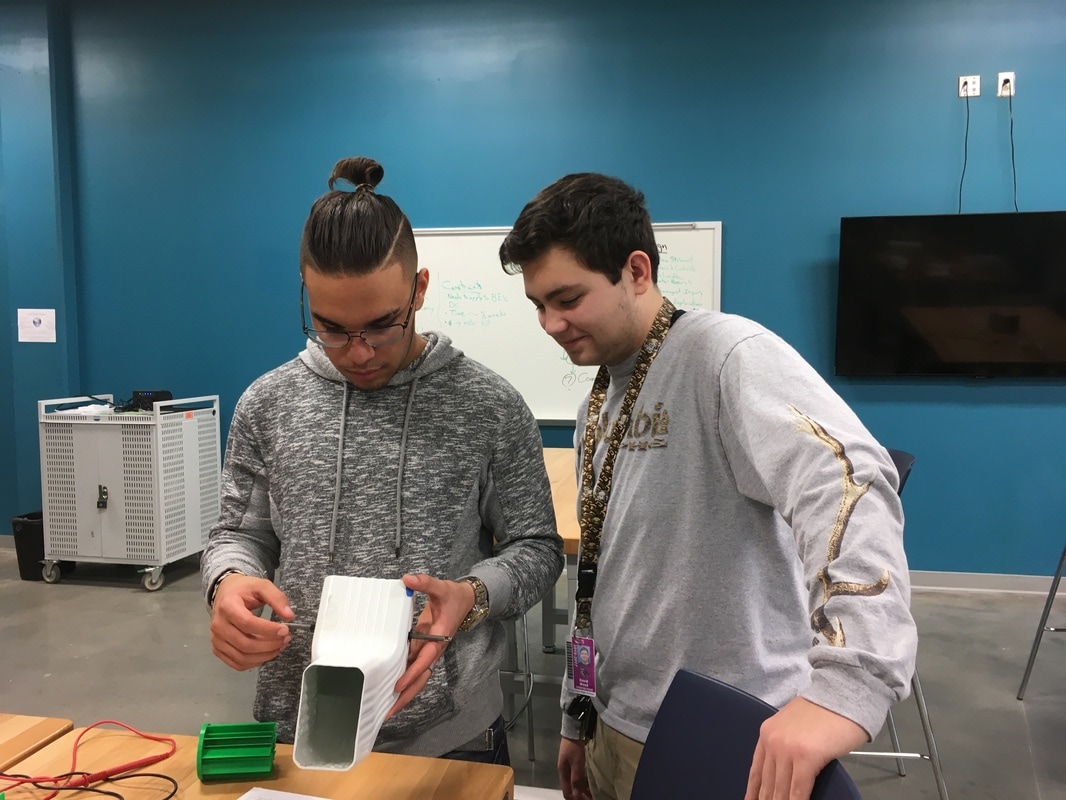
Step 2: Brainstorming and Constructing a Prototype
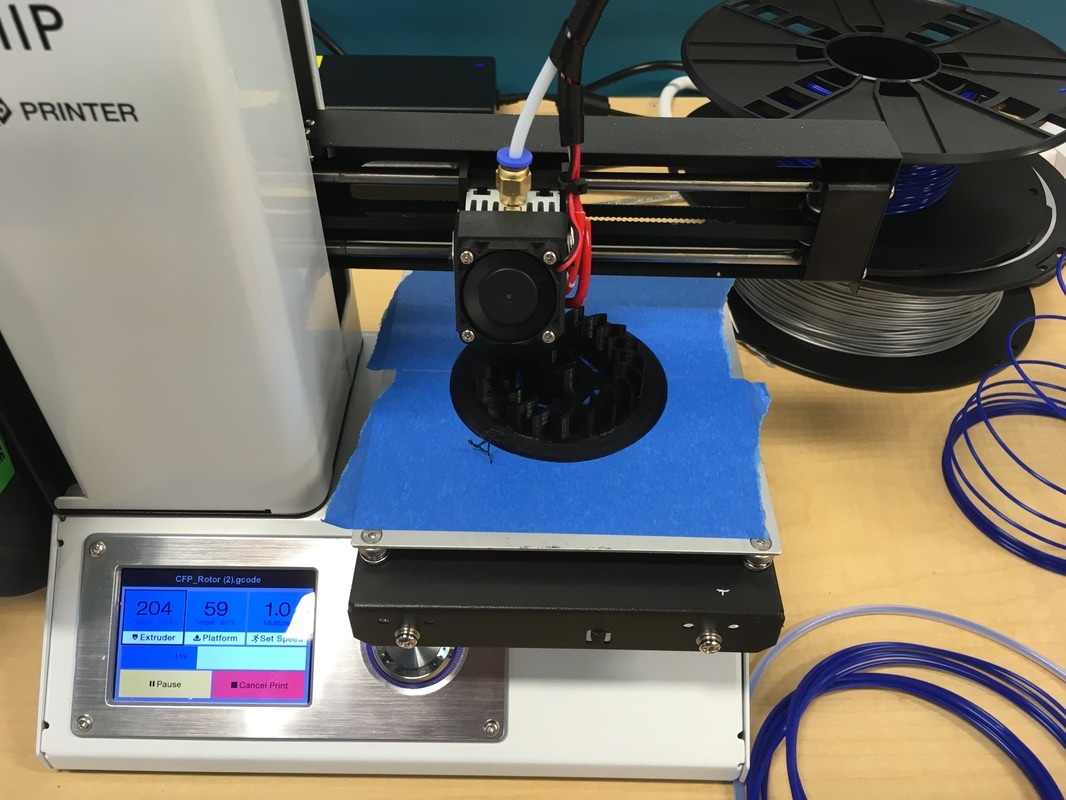
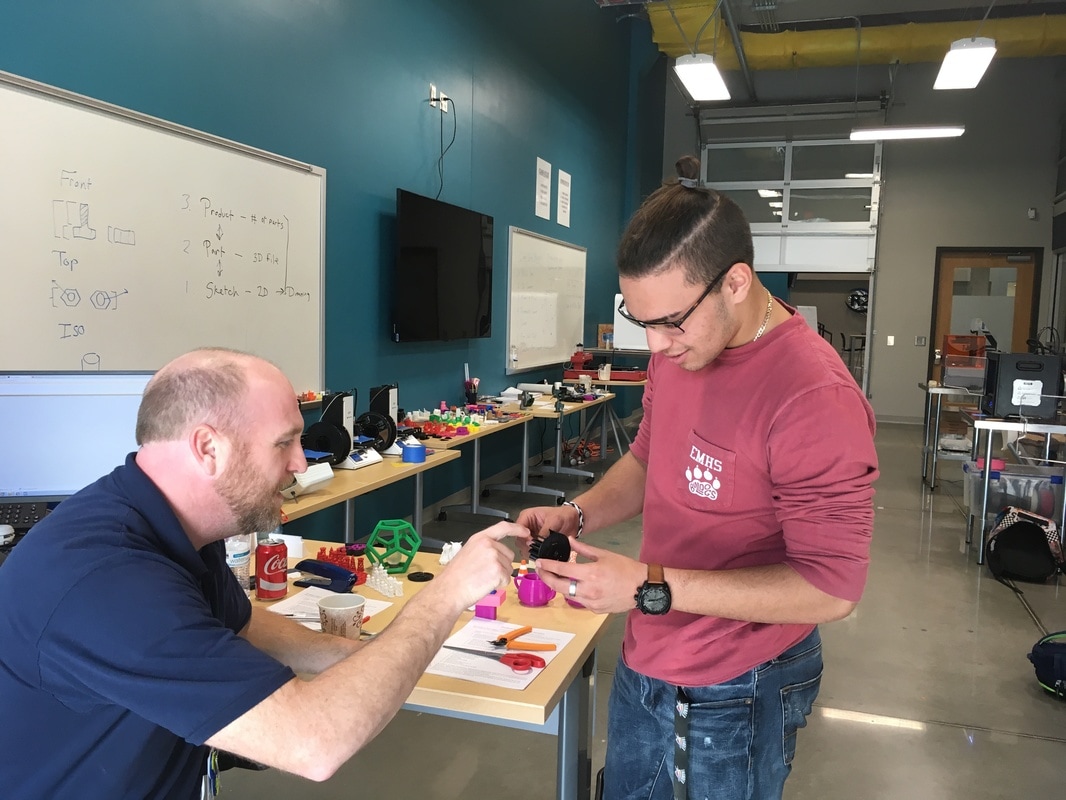
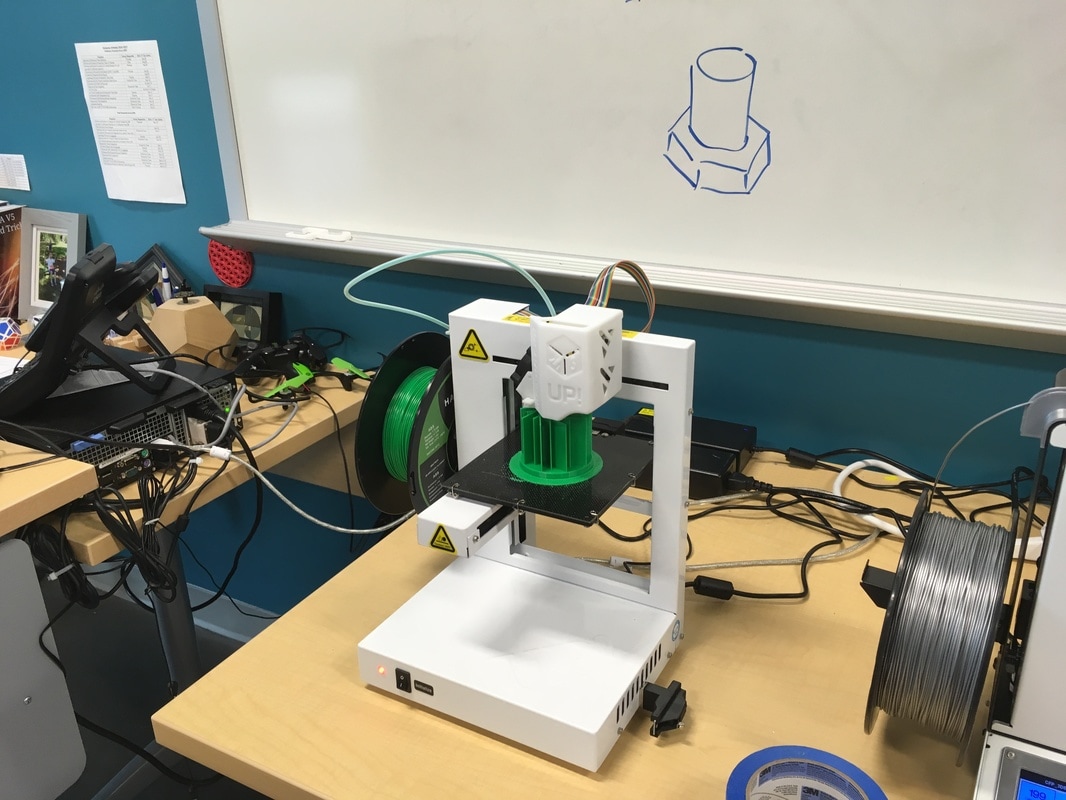
Next Energy students used an existing hydropower wheel to learn to calculate voltage, current, and gear ratio. Meanwhile, CAD/CAM students explored existing hydrowheel designs and used the 3D printer to create a prototype mounted on a wind turbine shaft. We thought we could then connect the gears from the wind turbine assembly to a motor and use the oscilloscope function to calculate RPM of the motor and hydrowheel.
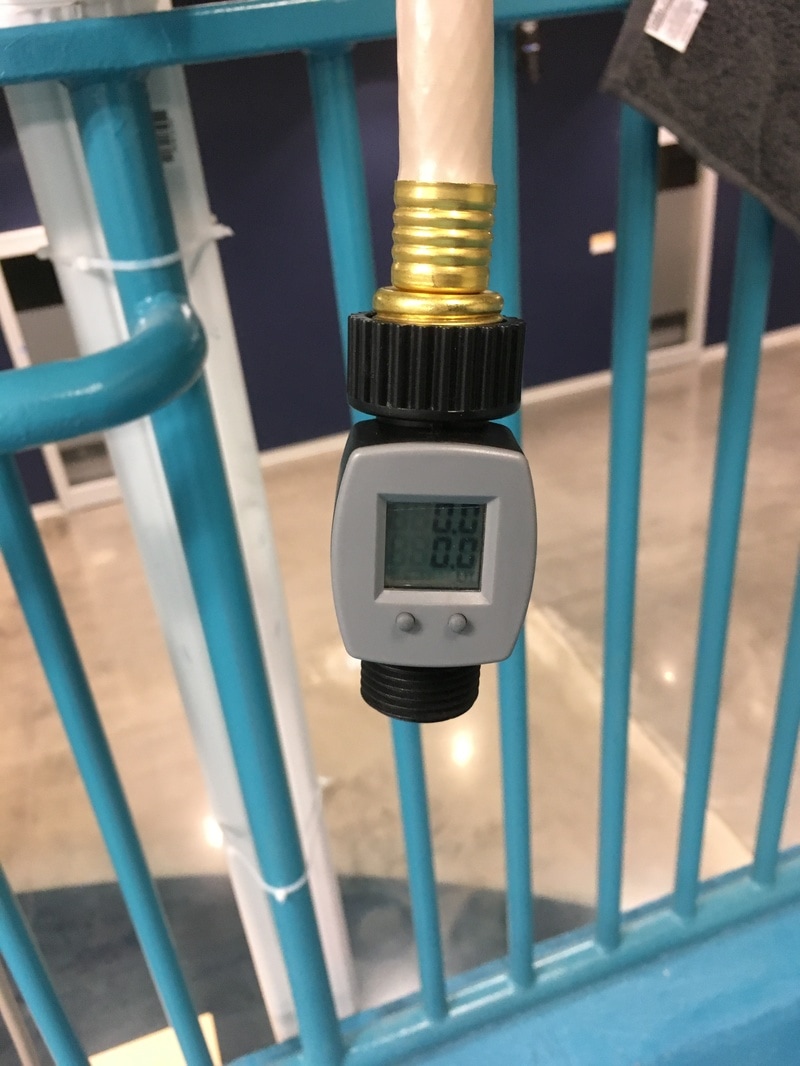
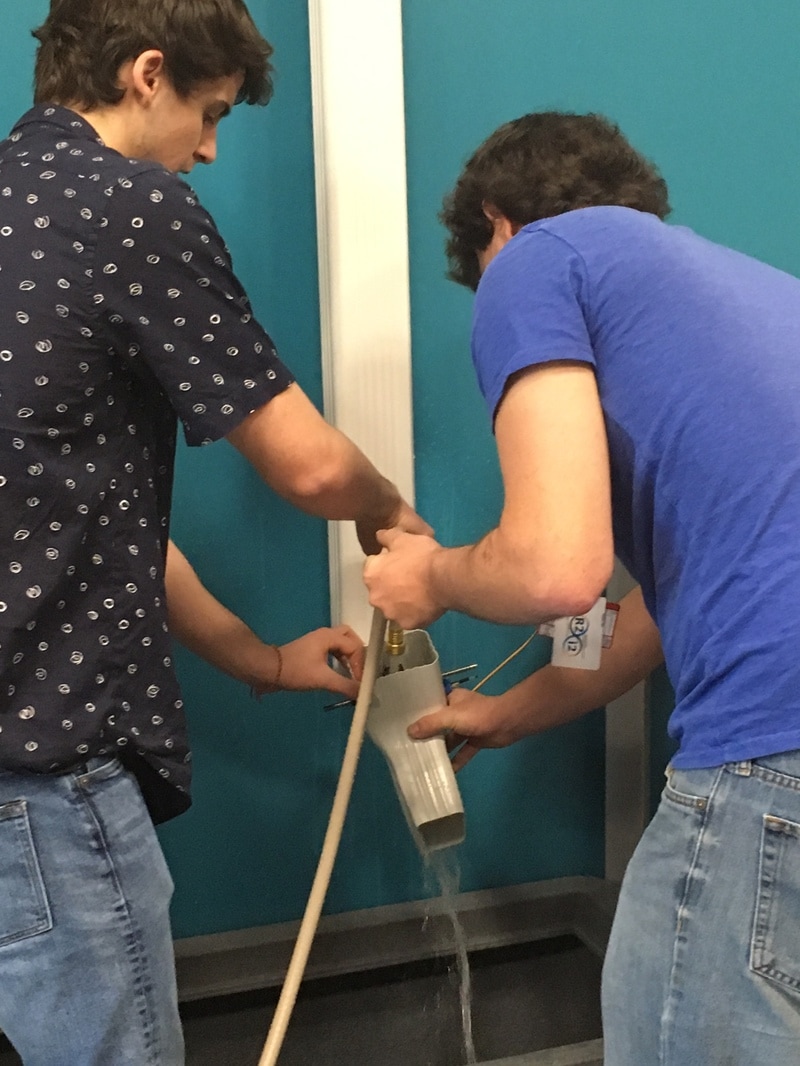
Unfortunately, we discovered that the water flow from the faucet, which is more than sufficient to emulate flood-level water velocities, did not allow the gears to move the motor. On its own, however, the hydrowheel spun quickly. We changed the shaft to one that has a permanent magnet, and tried a Hall Effect Sensor to calculate RPM. The Hall Effect Sensor uses a changing magnetic field to detect the revolutions per minute of the hydrowheel. We also used a flow rate calculator to determine the velocity of our testing environments.
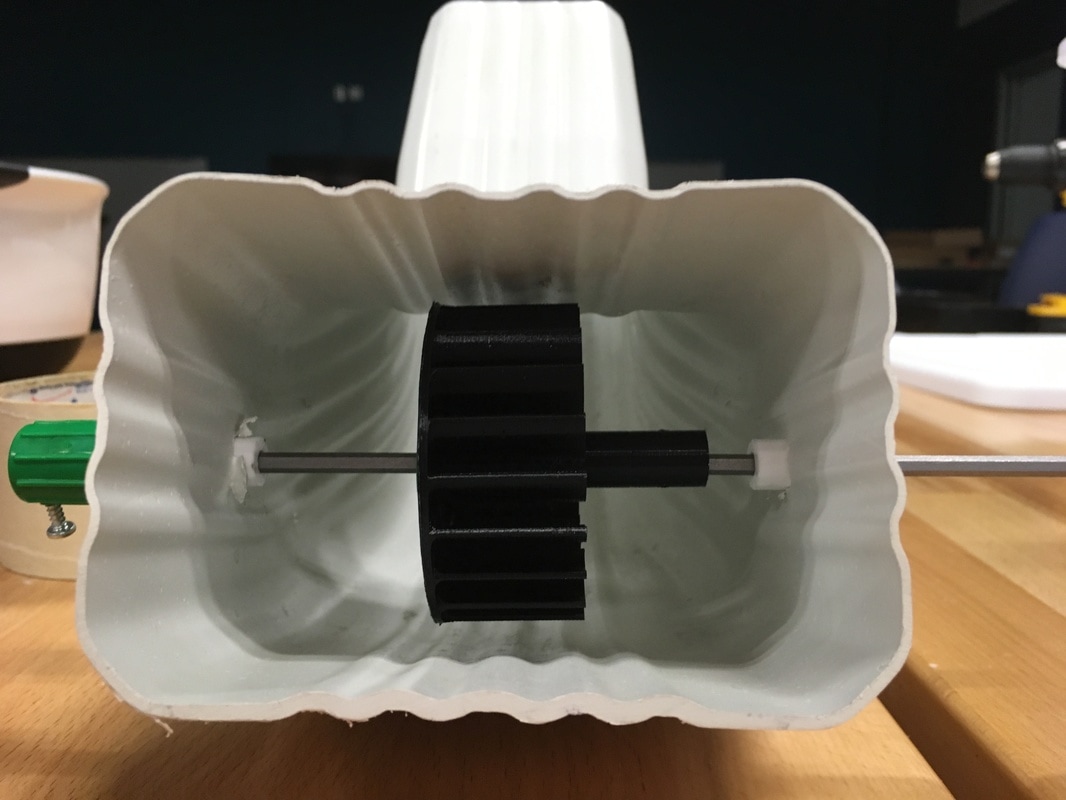
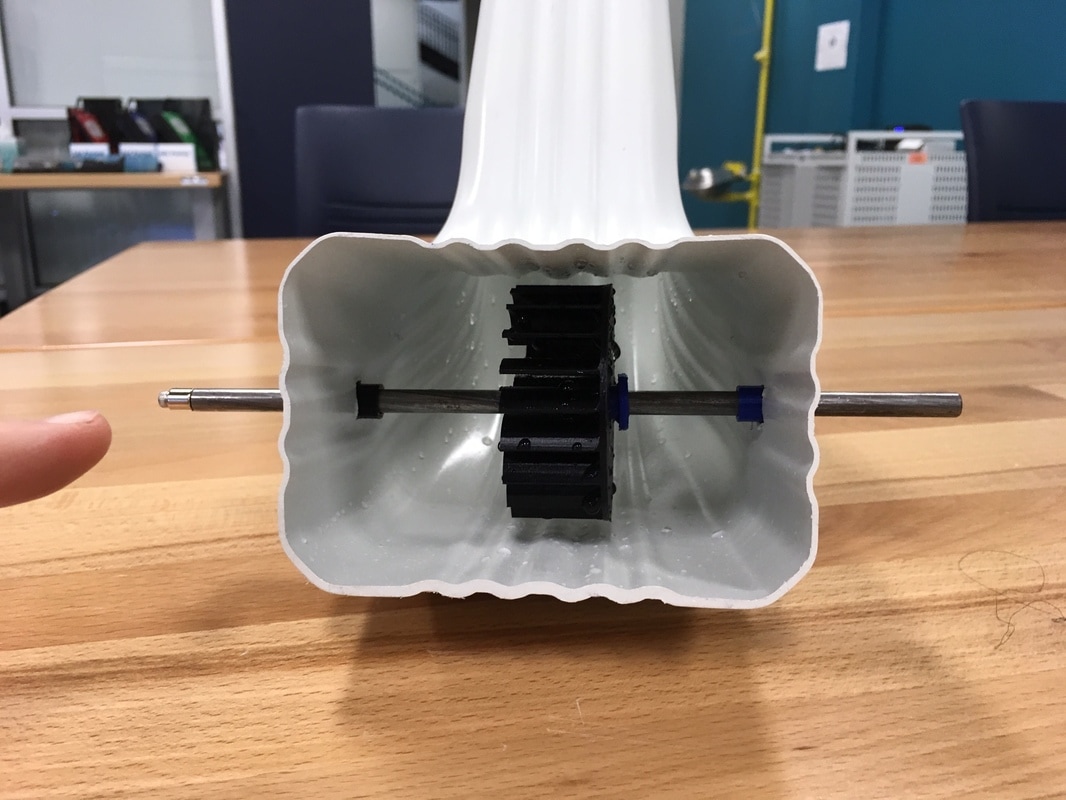
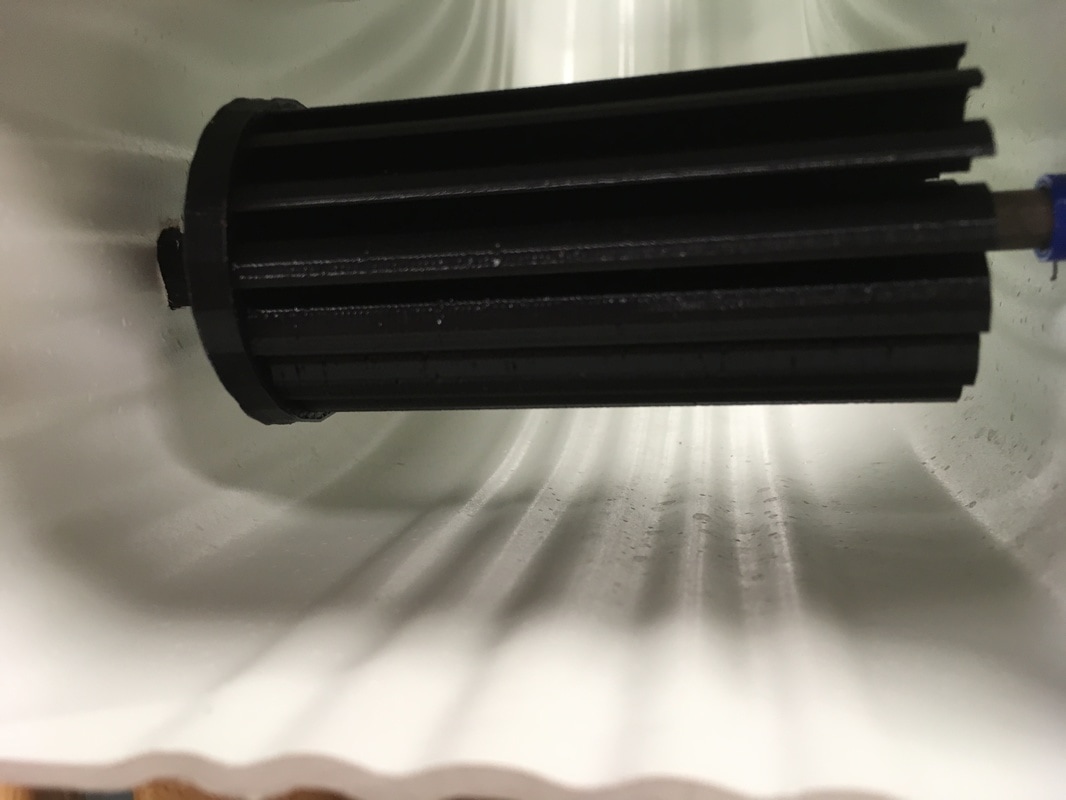
With the larger shaft , the hydropower wheel spun independently of the shaft. Through trial and error, we found that adding a wedge to fix the wheel to its axle allowed the wheel to spin with the shaft.
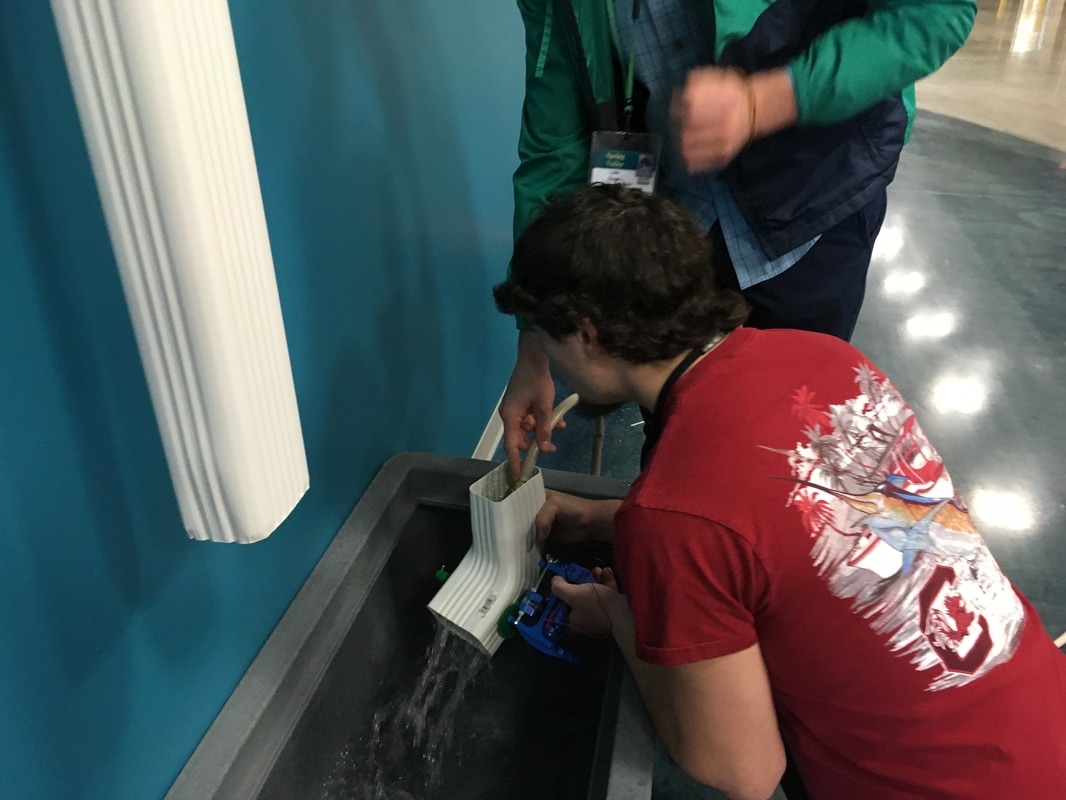
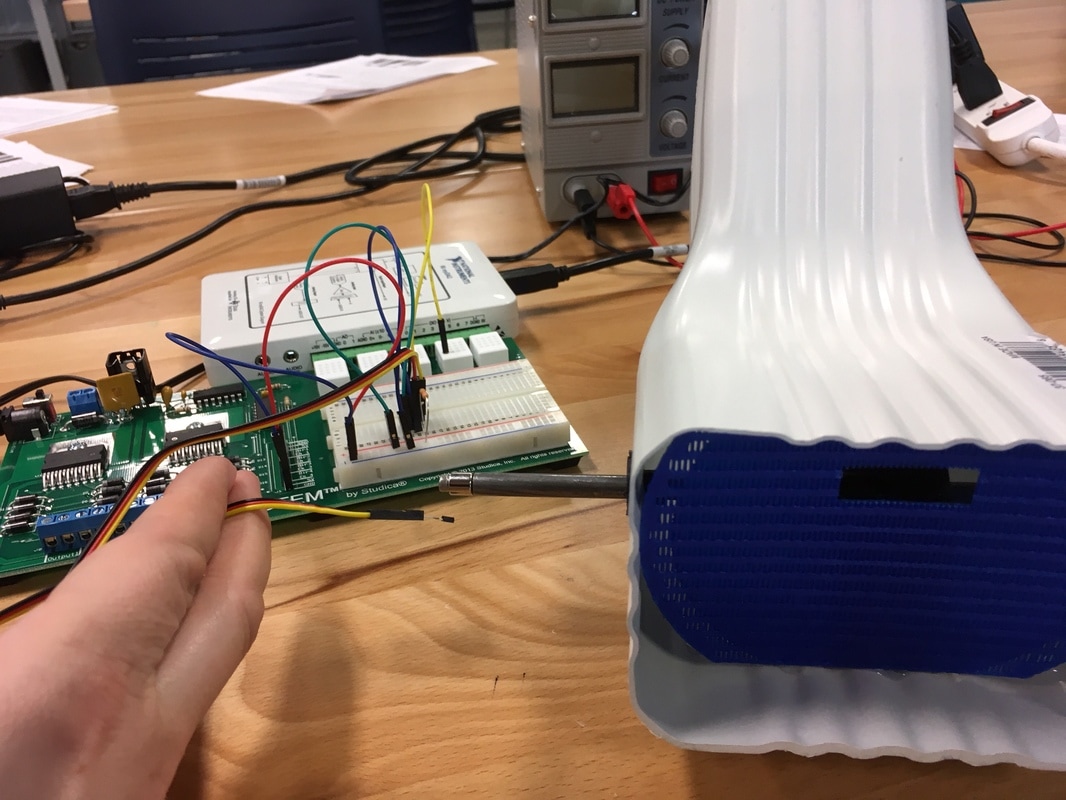
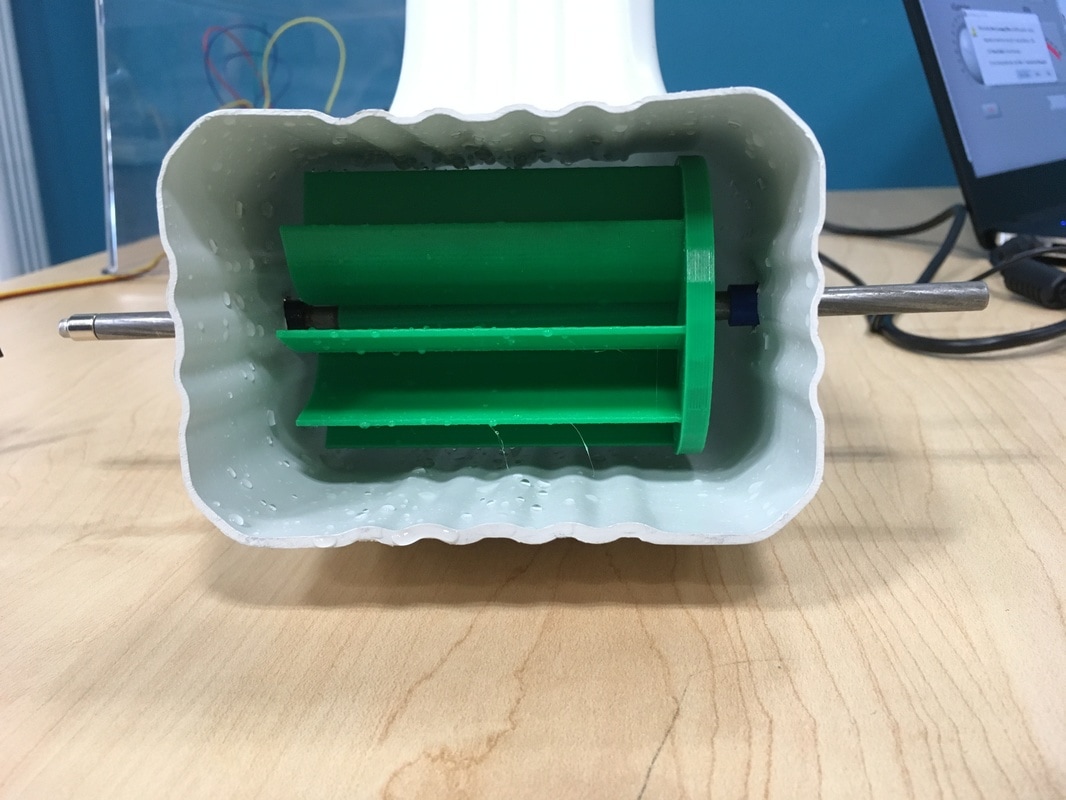
The next problem we ran into was that water running through the drainpipe did not always hit the hydrowheel in the correct place, which meant it would not always spin. CAD/CAM came to our rescue again by 3D printing a screen (shown in blue below) that focused the stream of water directly at the wheel.
With the larger shaft , the hydropower wheel spun independently of the shaft. Through trial and error, we found that adding a wedge to fix the wheel to its axle allowed the wheel to spin with the shaft.
The next problem we ran into was that water running through the drainpipe did not always hit the hydrowheel in the correct place, which meant it would not always spin. CAD/CAM came to our rescue again by 3D printing a screen (shown in blue below) that focused the stream of water directly at the wheel.
Step 3: Testing the Prototype
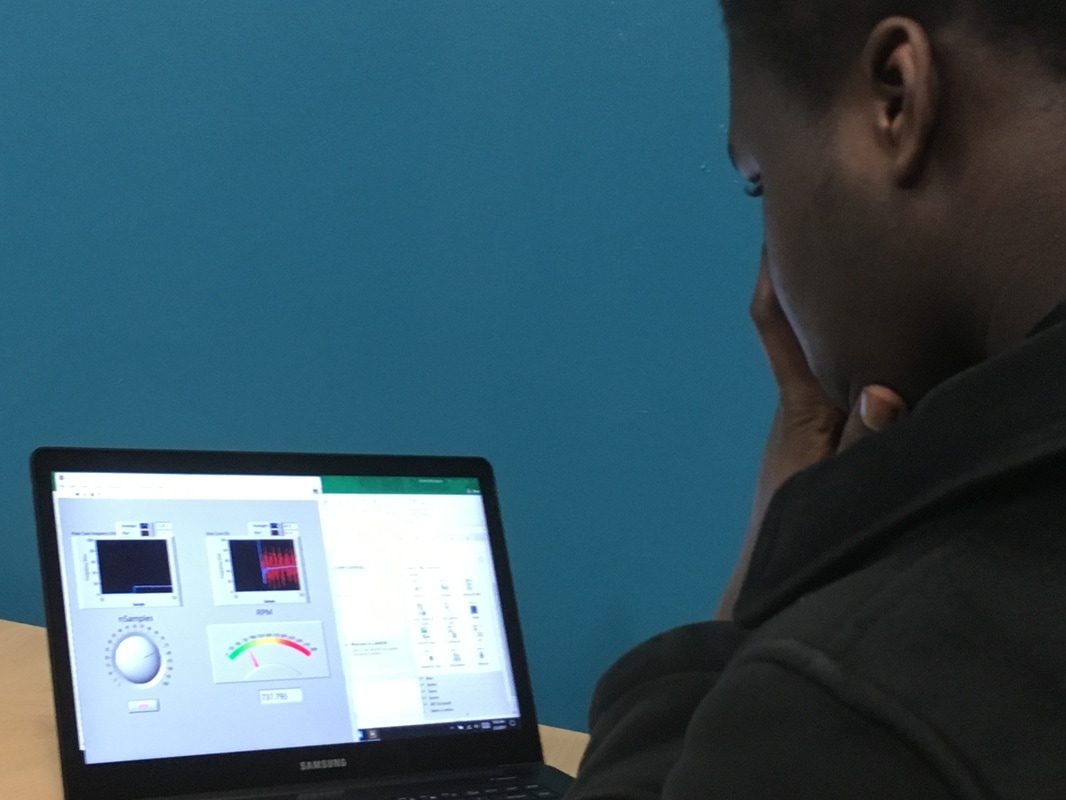
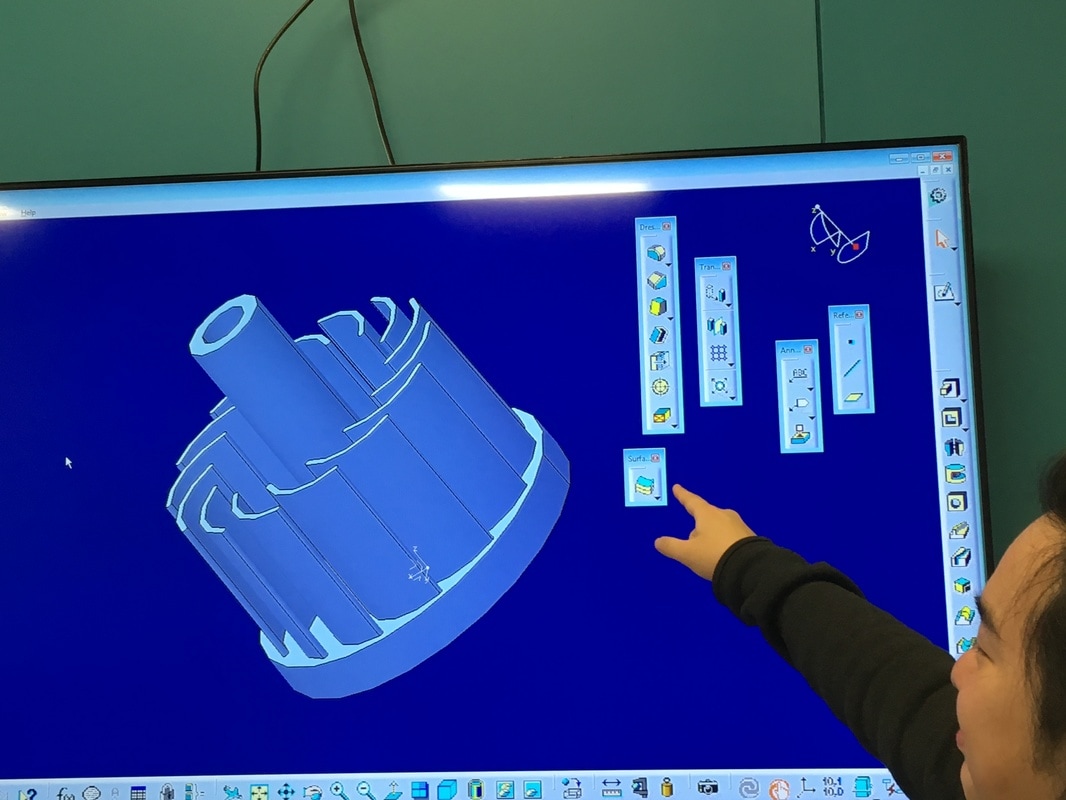
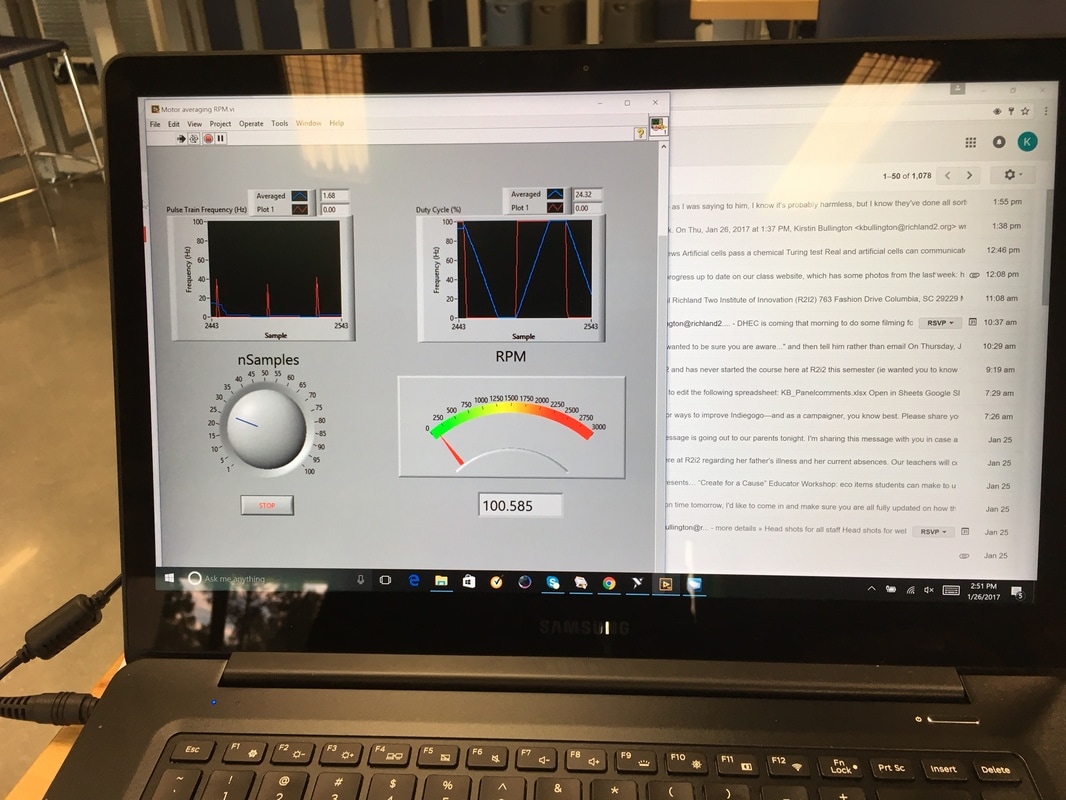
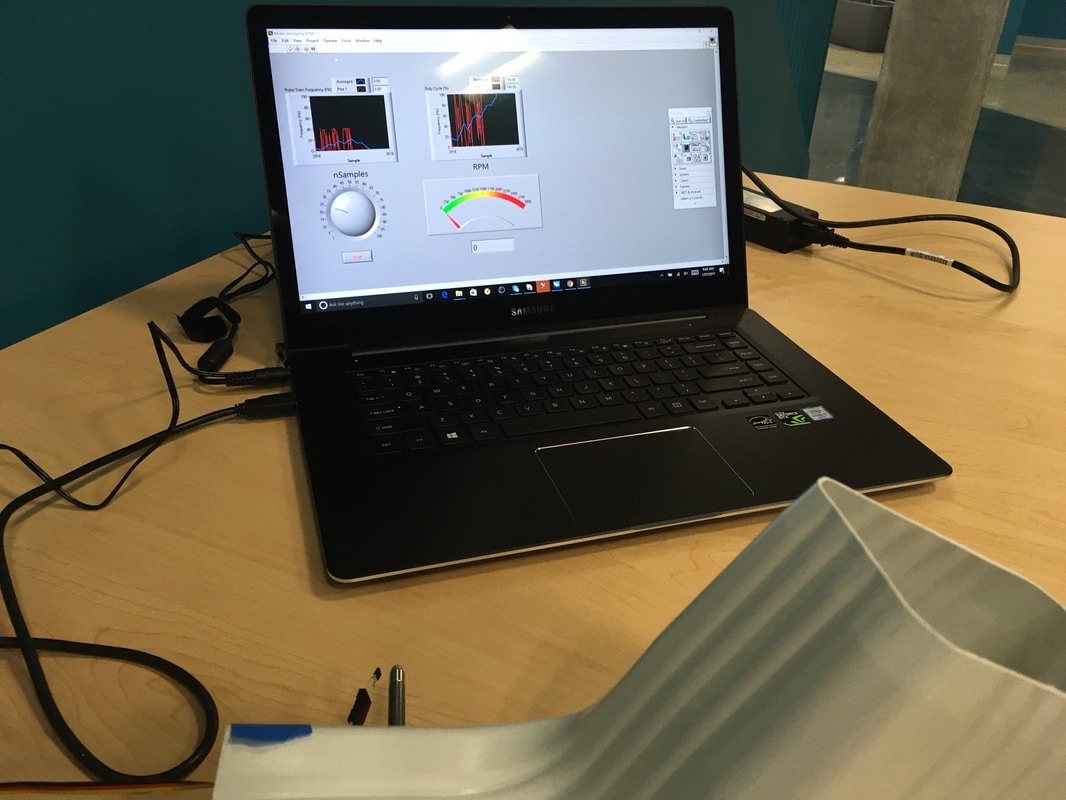
Finally, some success! Our first trials with the Hall Effect sensor in our prototype setup (using LabView, the mySTEM board, and a myDAQ) yielded RPMs from the hydrowheel varying between 100 and 2000+ RPM, depending on water flow. We know now that we can in fact use a permanent magnet and the sensor to determine the RPM of the wheel under different conditions, and that the current design of the hydrowheel (see CAD drawing above) can withstand water pressure beyond flooding conditions. Here are the next steps that we need to take to make our flood system functional:
1. Switch sensor testing environment to Raspberry Pi to enable Bluetooth functions (since it is probably not a good idea to leave a laptop out in the rain!);
2. Finalize calculations to link RPM of hydrowheel with different water flow rates, and program alarm to sound when the velocity of the motor indicates flooding is occurring;
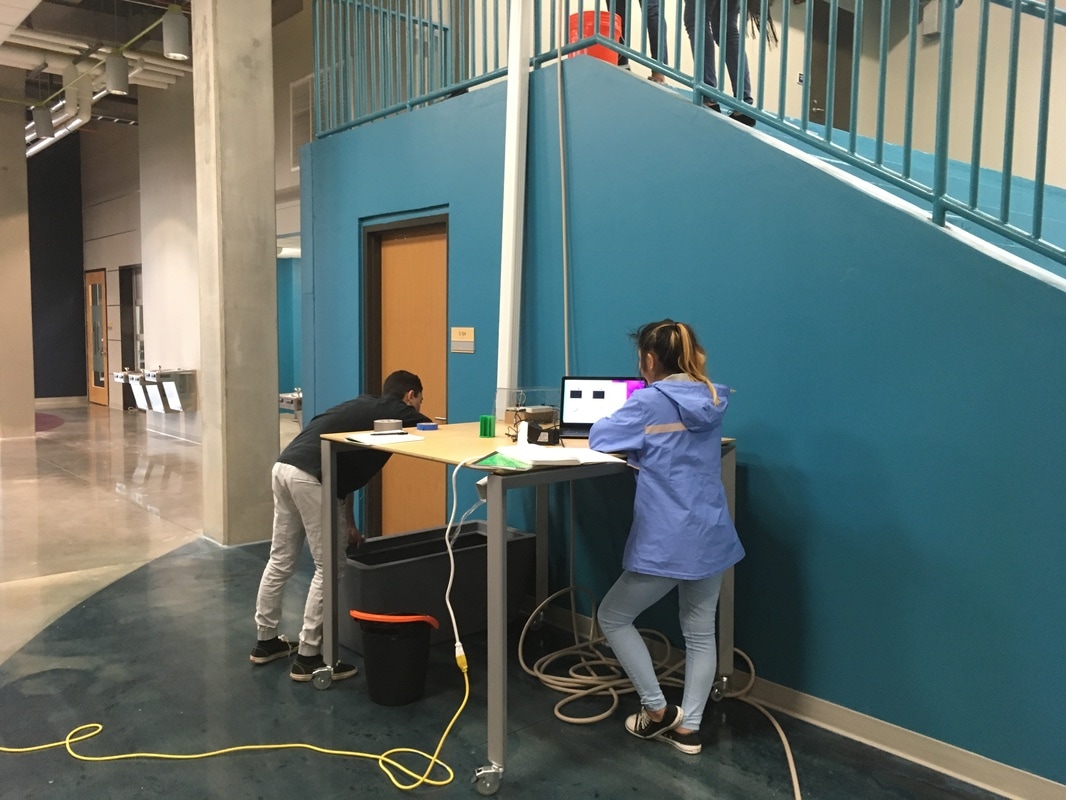
3. Improve testing environment to simulate rainfall and make use of the 10 ft vertical gutter similar to those found on houses in the area.
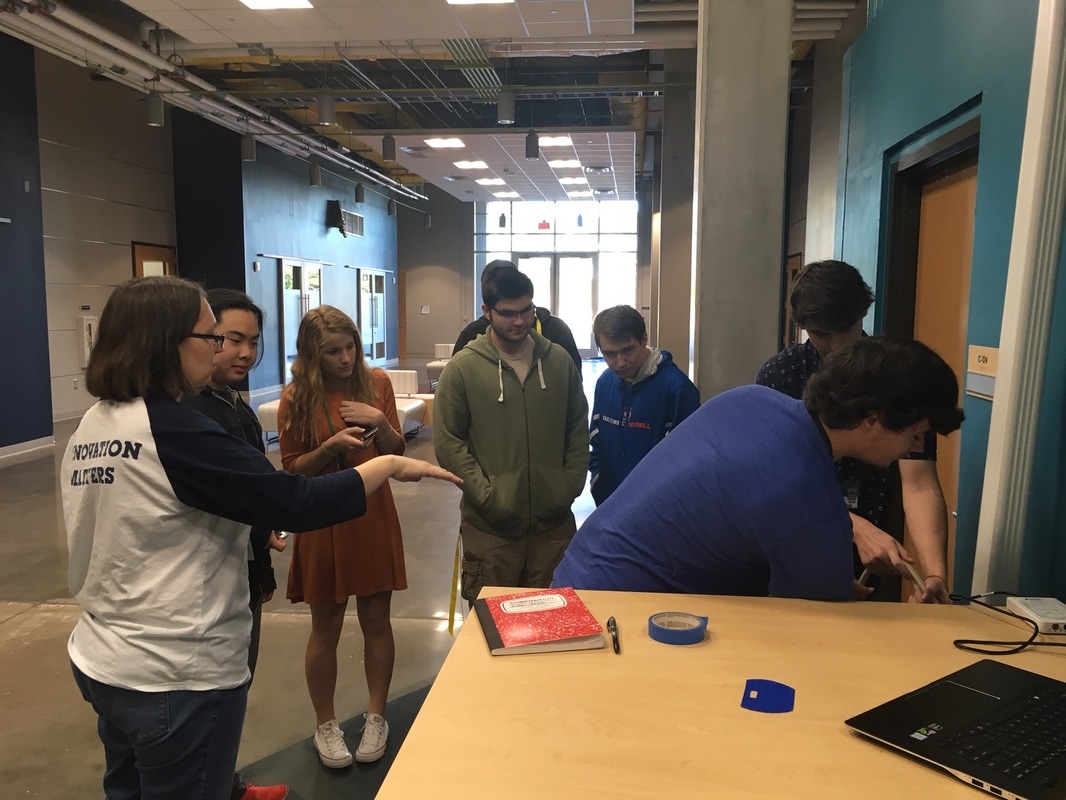
Once we have those components, we should have a functional prototype to share with the community! Last night, we described our project at the school information night to over one hundred people, and there was definitely interest in seeing the final results.
1. Switch sensor testing environment to Raspberry Pi to enable Bluetooth functions (since it is probably not a good idea to leave a laptop out in the rain!);
2. Finalize calculations to link RPM of hydrowheel with different water flow rates, and program alarm to sound when the velocity of the motor indicates flooding is occurring;
3. Improve testing environment to simulate rainfall and make use of the 10 ft vertical gutter similar to those found on houses in the area.
Once we have those components, we should have a functional prototype to share with the community! Last night, we described our project at the school information night to over one hundred people, and there was definitely interest in seeing the final results.
Step 4: Refining the design and testing environment
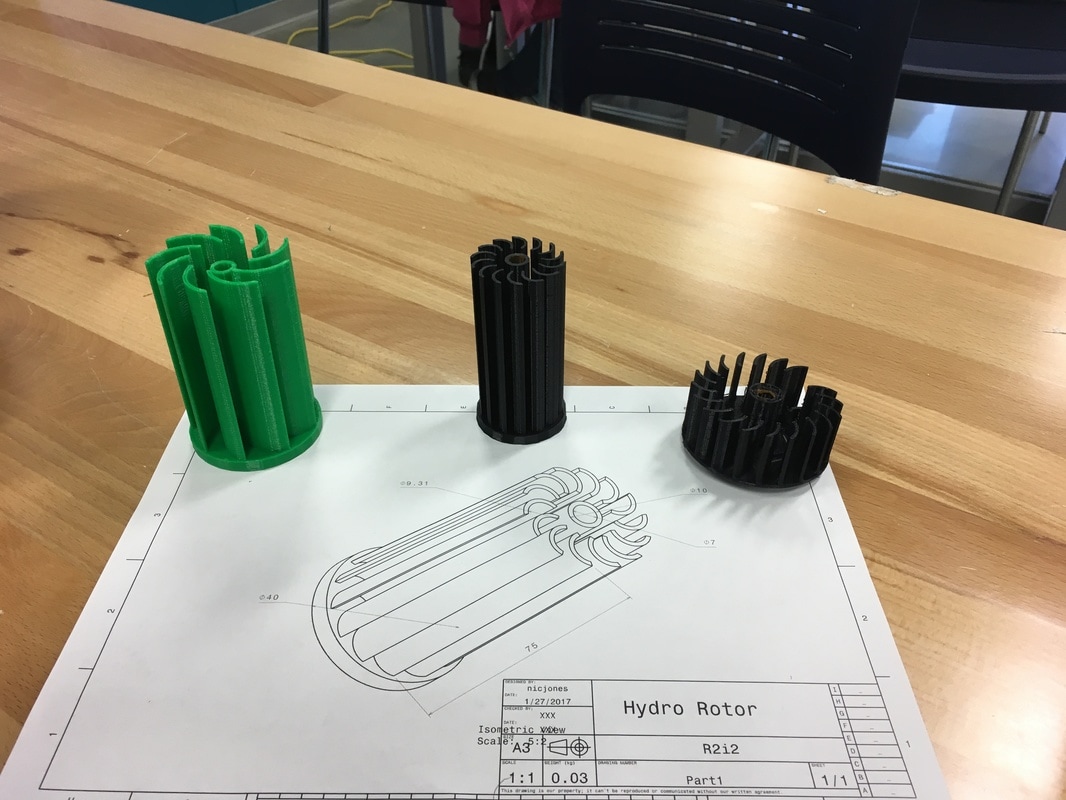
After testing the original hydrowheel design, CAD/CAM students and Next Energy discussed options and came up with a few other ideas for us to try. The main improvement suggested was to expand the size of the wheel, both in diameter and in length, in order to take into consideration that most of the water will cling to the sides. This is one of the great things about 3D printing prototypes; you can make minor adjustments, print the new design, and be testing it in the same day!
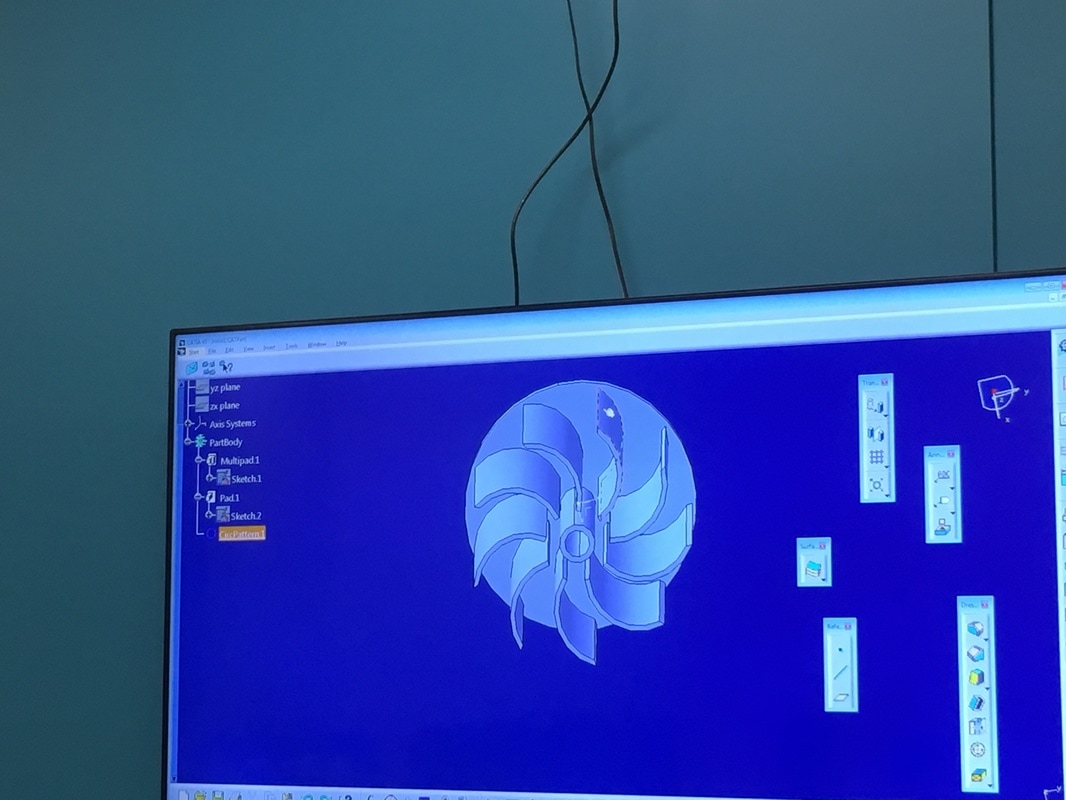
After expanding the width and diameter, it became clear that unless the water hit at just the right angle, our second prototype would not spin reliably. CAD/CAM classes expanded out the edges of the turbine blades and added some torsion to capture the falling rainwater more efficiently.
After expanding the width and diameter, it became clear that unless the water hit at just the right angle, our second prototype would not spin reliably. CAD/CAM classes expanded out the edges of the turbine blades and added some torsion to capture the falling rainwater more efficiently.

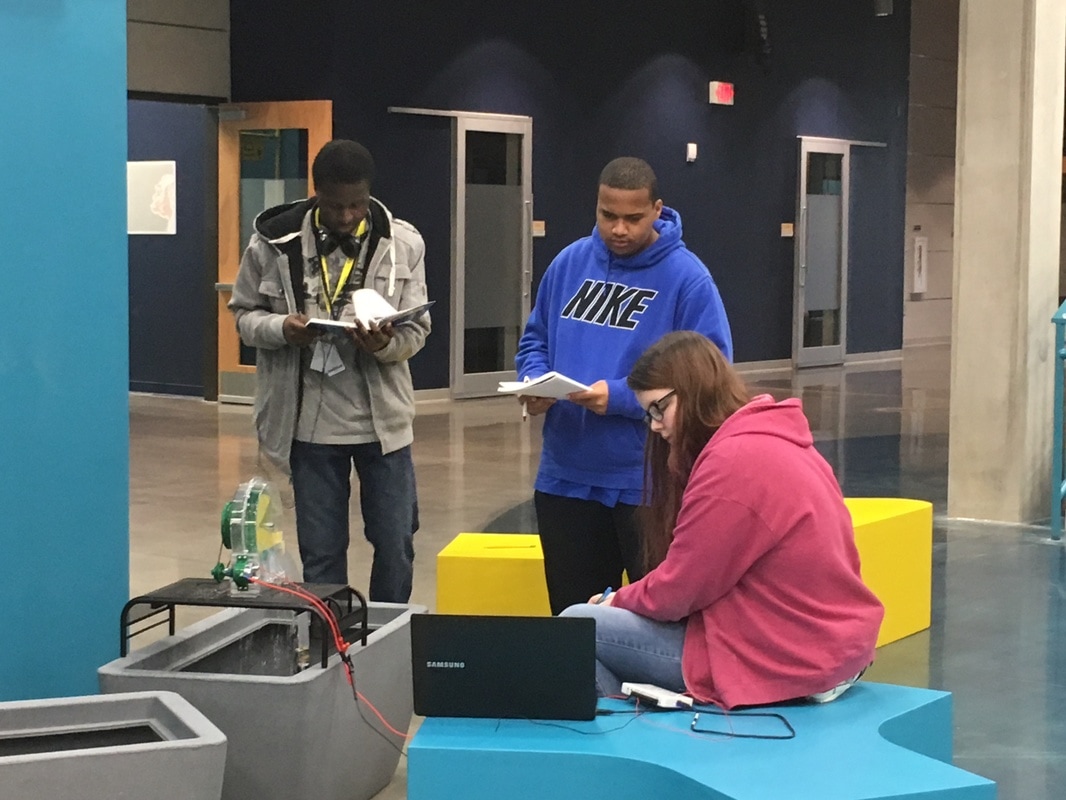
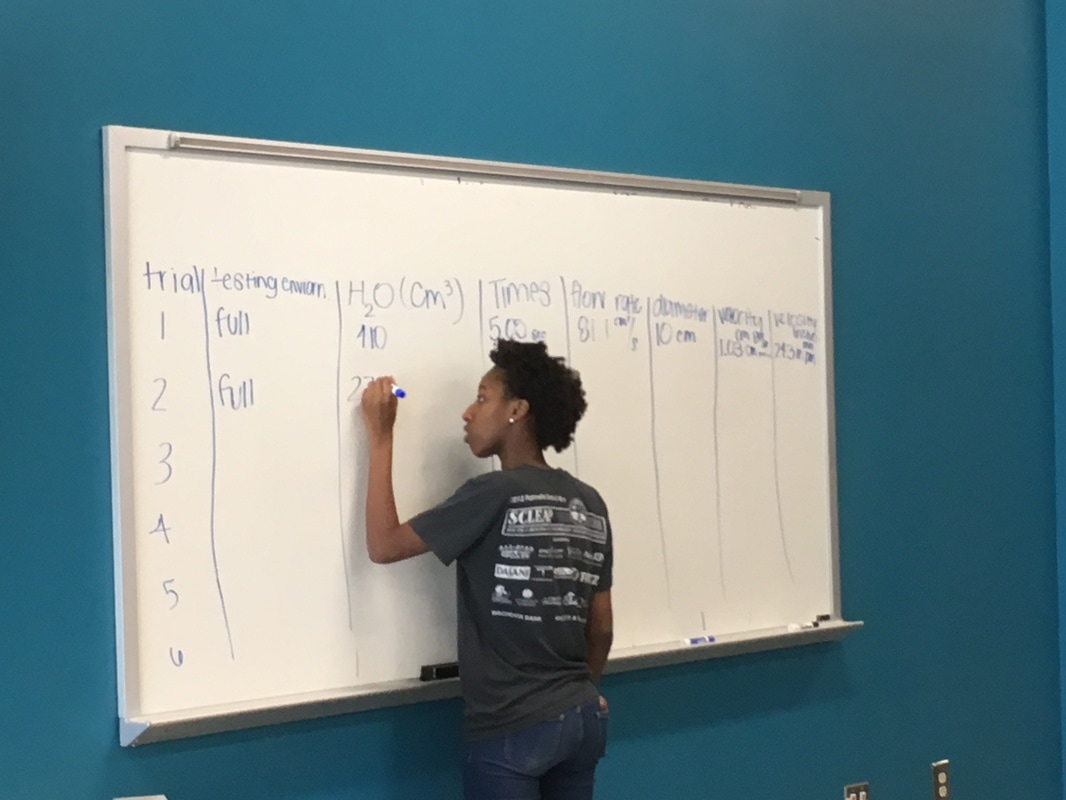
Meanwhile, Next Energy was hard at work testing each variation of the hydrowheel and trying to establish a connection between the water flow in our indoor testing environment and rainfall. Using a flow meter and a timer, we were able to determine the flow rate of the water leaving the hose of 0.18 L/s on average, which is equivalent to over 11 inches of rain- which is well beyond the flooding threshold, but comparable to the flooding levels experienced in Columbia in the October 2015 floods. At this rate, our average RPM for hydrowheel was 724.